Pearson Edexcel International GCSE in Physics · 4PH1 · Free · no account needed
The Hertzsprung–Russell Diagram — exam questions
10 original Incandio exam-style questions on the Hertzsprung–Russell Diagram, 23 marks, about 23 minutes of writing. Each one carries the command word, the tariff and the specification statement it assesses, exactly as a paper presents them. This is an original Incandio practice question, written to reflect the structure and demands of the qualification. It is not an official Pearson Edexcel past-paper question.
This is the practice set for The Hertzsprung–Russell Diagram — the lesson that teaches it. Read the lesson first if the idea is new; come here when you want to find out whether you can turn it into marks. Completely free, no account needed to read.
What these questions ask of you
8 command words run through this set, and on Pearson Edexcel International GCSE Physics each one means something precise. Answering the wrong command is the commonest way a candidate who understands the lesson still loses the mark.
- Which (1 mark)
- one option chosen from the set given
- State what is meant by (1–2 marks)
- the definition
- Give (1–2 marks)
- a short factual answer
- Describe (2–4 marks)
- developed, linked statements of what happens — including a named direction where one exists
- Explain (2–4 marks)
- the physics that causes it, set out as a line of reasoning Misread as: describing the change without giving the physical reason for it
- Compare (2–4 marks)
- explicit comparison naming both cases
- Suggest (1–3 marks)
- a plausible answer applying taught physics to an unfamiliar arrangement
- Identify (1–2 marks)
- the correct item selected from what is shown
Assessed on Paper 1 (4PH1/1P) and Paper 2 (4PH1/2P), against AO1, AO2, AO3.
Where these sit in the specification
Pearson Edexcel International GCSE Physics (4PH1) — statements 8.12 · 8.11. Incandio is aligned to this specification; it is not published by, endorsed by or affiliated with Pearson, and it reproduces none of Pearson's wording.
The 10 questions
Answer them on paper, then open the lesson's exam practice to have them marked. The mark scheme, the accepted and rejected answers and the annotated model answer are in Incandio and are not printed here — an answer beside its question is not practice.
-
A student was given the surface temperature and absolute magnitude of four stars and asked to place each one on a Hertzsprung–Russell diagram. On the diagram, temperature increases to the left and absolute magnitude is plotted so that brighter stars appear higher up.
Table 1 — four stars to plot Star Surface temperature / K Absolute magnitude Region J 5 800 +4.8 main sequence K 3 500 −5.5 to be identified L 25 000 +11.0 to be identified M 20 000 −4.0 main sequence (a)
(1)Identify
Identify the star in Table 1 that would be plotted furthest to the left.
A student was given the surface temperature and absolute magnitude of four stars and asked to place each one on a Hertzsprung–Russell diagram. On the diagram, temperature increases to the left and absolute magnitude is plotted so that brighter stars appear higher up.
Table 1 — four stars to plot Star Surface temperature / K Absolute magnitude Region J 5 800 +4.8 main sequence K 3 500 −5.5 to be identified L 25 000 +11.0 to be identified M 20 000 −4.0 main sequence (b)
(2)Identify
Identify the regions of the diagram in which stars K and L would be plotted, using Table 1.
A student was given the surface temperature and absolute magnitude of four stars and asked to place each one on a Hertzsprung–Russell diagram. On the diagram, temperature increases to the left and absolute magnitude is plotted so that brighter stars appear higher up.
Table 1 — four stars to plot Star Surface temperature / K Absolute magnitude Region J 5 800 +4.8 main sequence K 3 500 −5.5 to be identified L 25 000 +11.0 to be identified M 20 000 −4.0 main sequence (c)
(4)Explain
Explain how stars J and M can both be on the main sequence when Table 1 gives them such different values.
A student was given the surface temperature and absolute magnitude of four stars and asked to place each one on a Hertzsprung–Russell diagram. On the diagram, temperature increases to the left and absolute magnitude is plotted so that brighter stars appear higher up.
Table 1 — four stars to plot Star Surface temperature / K Absolute magnitude Region J 5 800 +4.8 main sequence K 3 500 −5.5 to be identified L 25 000 +11.0 to be identified M 20 000 −4.0 main sequence (Total for Question 1 = 7 marks)
-
(1)Which
Which group of stars forms the diagonal band across a Hertzsprung–Russell diagram?
Group A white dwarfs B red giants C the main sequence D supergiants (Total for Question 2 = 1 mark)
-
(1)State what is meant by
State what is meant by the absolute magnitude of a star.
(Total for Question 3 = 1 mark)
-
(1)Give
Give the position on a Hertzsprung–Russell diagram where white dwarfs are found.
(Total for Question 4 = 1 mark)
-
(4)Describe
Describe the main features of a Hertzsprung–Russell diagram.
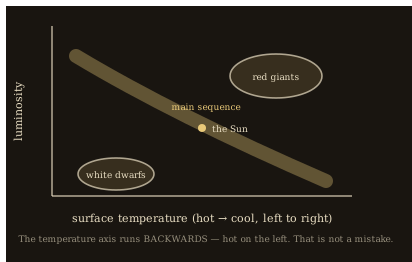
Figure 1 — a Hertzsprung–Russell diagram (Total for Question 5 = 4 marks)
-
(3)Explain
Explain why absolute magnitude rather than apparent brightness is plotted on a Hertzsprung–Russell diagram.
(Total for Question 6 = 3 marks)
-
(3)Compare
Compare the position of a red supergiant on a Hertzsprung–Russell diagram with that of a white dwarf.
(Total for Question 7 = 3 marks)
-
(3)Suggest
Suggest what the cluster's diagram shows about the ages of its stars.
A star cluster — Astronomers plotted every star in one cluster on a Hertzsprung–Russell diagram. The lower right part of the main sequence is fully populated, but the top left is empty: no hot, bright main-sequence stars remain. Instead there is a group of red giants above the point where the main sequence stops. All the stars in a cluster formed at the same time.
(Total for Question 8 = 3 marks)
Have them marked, then defend the answer
Practice tells you the mark; teaching it back tells you whether you understand it. On Incandio a topic counts as mastered only once you have taught it and defended it.
- Mark these questions — 10 questions, marked on Incandio against the authored scheme, with the mistake you actually made named.
- Teach it — explain the Hertzsprung–Russell Diagram to Ember, an AI pupil who does not have it yet and asks the awkward question.
- Defend it — argue it against Ejnar Hertzsprung over three rounds, marked against descriptors you can read first.
Completely free. No subscriptions, no paywalls, no account needed to start.
Back to the lesson
- The Hertzsprung–Russell Diagram — Plot every star by colour and true brightness and they do not scatter — they fall into groups.
- All of Incandio Physics · Incandio Exam Practice