Pearson Edexcel International GCSE in Physics · 4PH1 · Free · no account needed
The Hertzsprung–Russell Diagram
Plot every star by colour and true brightness and they do not scatter — they fall into groups.
Topic 8 · Astrophysics — one of 7 lessons in this topic, and one of 65 in Physics.
This lesson ends with Ejnar Hertzsprung. Learn the Hertzsprung–Russell Diagram, teach it, then defend it against Ejnar Hertzsprung.
The definition this lesson teaches, word for word — every Physics definition.
- Absolute magnitude
- A measure of how bright a star would appear if it were placed at a standard distance from Earth. Because every star is compared at the same distance, differences in absolute magnitude are genuine differences in the light emitted.
What this lesson covers in the specification
Incandio is aligned to this specification. It is not published by, endorsed by or affiliated with Pearson, and it reproduces none of Pearson's wording — the statement numbers are given so you can check every lesson against your own copy.
- 8.11 — Absolute magnitude as brightness at a standard distance (bold P statement — Paper 2 only)
- 8.12 — Drawing the main components of the Hertzsprung–Russell diagram (bold P statement — Paper 2 only)
Specification section 8(c) Stellar evolution — also taught in The Life Cycle of Stars, The Big Bang and its Evidence.
1 · Understand it
No exam language yet. The only question this section answers is: do I actually understand what is happening?
How bright a star LOOKS from Earth is nearly useless for comparing stars, because it confuses two entirely different things: how much light the star actually emits, and how far away it is. A dim star nearby and a brilliant star far off can look identical.
The fix is to remove the distance from the comparison. ABSOLUTE MAGNITUDE is a measure of how bright a star WOULD appear if it were placed at a standard distance from Earth — the same standard distance for every star. Since every star is then imagined at the same distance, any difference in absolute magnitude is a genuine difference in how much light the star emits.
Think of it like comparing runners by their times rather than their finishing positions
Finishing positions in different races tell you almost nothing about who is faster, because they depend on who else turned up. Times over a standard distance are comparable across every race ever run, because the distance has been fixed by agreement. Absolute magnitude is that fixed distance. Apparent brightness is a finishing position — it tells you what you saw from where you were standing, and confuses the runner's ability with the strength of the field. Move every star to the same imaginary distance and what is left is the star itself.
One convention has to be flagged because it catches everyone. On the magnitude scale, SMALLER NUMBERS MEAN BRIGHTER STARS, and the brightest objects have negative magnitudes. This is inherited from an ancient Greek system in which the most prominent stars were called stars 'of the first magnitude' and the faintest 'of the sixth', and it has never been changed.
Now the diagram itself, statement 8.12. Plot every star with SURFACE TEMPERATURE along the horizontal axis and LUMINOSITY, or absolute magnitude, up the vertical axis. The result is the striking thing: the points do not scatter evenly at all. They fall into a few well-defined groups, and that structure is what the diagram is for.
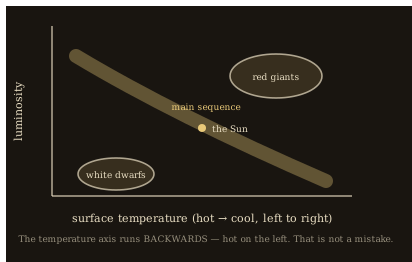
The three regions to be able to draw and identify
- THE MAIN SEQUENCE — a broad diagonal band running from hot and bright at the top left down to cool and dim at the bottom right. Most stars are here, including the Sun, and every star on this band is fusing hydrogen in its core.
- THE RED GIANTS AND SUPERGIANTS — up and to the RIGHT of the main sequence. They are cool at the surface, which puts them to the right, and yet very bright, which puts them high up. That combination is only possible if they are enormous, and that is exactly what they are.
- THE WHITE DWARFS — down and to the LEFT. They are very hot at the surface, which puts them to the left, and yet very dim, which puts them low down — so they must be very small, which is precisely what a white dwarf is.
- So a star's POSITION reveals its size, which colour alone could never do. That is the whole reason for plotting the two quantities against each other.
- Position also reveals the STAGE of a star's life, since a star moves off the main sequence when its core hydrogen runs out.
That third step is worth pausing on, because it resolves the ambiguity left at the end of the colour lesson. A red star could be a tiny dim dwarf or a vast bright supergiant, and colour cannot separate them. Add the second axis and they land in completely different regions of the plot — because for two stars at the same surface temperature, the brighter one must have more surface to emit from, and therefore must be bigger.
The backwards temperature axis is a historical accident and will not be corrected. The diagram was originally drawn against spectral class, which happened to run in that order, and by the time anyone might have tidied it up the convention was universal. Read it deliberately every time: LEFT IS HOT.
Identifying three stars from their positions
Three stars are plotted. Star P is at the top left. Star Q is at the top right. Star R is at the bottom left. Identify each and say what its position reveals about its size.
- Top left means hot and bright. That is the upper end of the MAIN SEQUENCE — star P is a hot, luminous main-sequence star, blue in colour.
- Top right means COOL and bright. Cool surfaces emit little per unit area, so great total brightness requires an enormous surface: star Q is a RED GIANT or SUPERGIANT.
- Bottom left means HOT and dim. A hot surface emits a great deal per unit area, so low total brightness requires very little surface: star R is a WHITE DWARF.
- In each case the reasoning is the same: brightness and temperature together fix the surface area, and surface area is size.
Answer: P is a hot main-sequence star, Q a red giant, R a white dwarf — and each identification comes from combining the two axes.
2 · Grade 9 Notes
A different job from the section above. You have already understood it; this is the precise set of things to LEARN — definitions to reproduce word for word, processes in order, equations with units, and the answers that score full marks.
Learn this definition · Absolute magnitude
A measure of how bright a star would appear if it were placed at a standard distance from Earth. Because every star is compared at the same distance, differences in absolute magnitude are genuine differences in the light emitted.
Apparent brightness against absolute magnitude
A. APPARENT brightness is how bright a star looks from Earth. It depends on both the light emitted and the distance, so it cannot compare stars.
B. ABSOLUTE magnitude is how bright it would look at a standard distance. Distance is removed, so stars can be compared directly.
The three groups, defined
- Main sequence
- Stars currently fusing hydrogen in the core. A broad diagonal band from top left to bottom right; most stars, including the Sun.
- Red giant / supergiant
- Cool at the surface but very bright, so very large. Found at the top right.
- White dwarf
- Very hot at the surface but very dim, so very small. Found at the bottom left.
Statement 8.12 — the three regions of the diagram
- MAIN SEQUENCE — a diagonal band from hot and bright at the TOP LEFT to cool and dim at the BOTTOM RIGHT. Most stars, including the Sun; all fusing hydrogen
- RED GIANTS AND SUPERGIANTS — TOP RIGHT: cool at the surface but very bright, so they must be enormous
- WHITE DWARFS — BOTTOM LEFT: very hot at the surface but very dim, so they must be very small
- The horizontal axis is SURFACE TEMPERATURE, running HOT ON THE LEFT
- The vertical axis is LUMINOSITY or absolute magnitude, brightest at the top
Reading a star's size from its position
- Read the surface temperature from the horizontal position, remembering that left is hot.
- Read the total brightness from the vertical position.
- A hot surface emits a great deal of light per unit area; a cool surface emits very little.
- So bright AND cool means a very large surface area — a giant or supergiant.
- And dim AND hot means a very small surface area — a white dwarf.
Model answer [3 marks]
Explain why absolute magnitude is used rather than how bright a star appears from Earth when comparing stars. [3]
How bright a star appears from Earth depends both on how much light it emits and on how far away it is, so a dim nearby star and a very bright distant one can appear equally bright and cannot be compared. Absolute magnitude is a measure of how bright a star would appear if it were placed at a standard distance from Earth. Because every star is compared at the same distance, the effect of distance is removed and any difference in absolute magnitude is a genuine difference in the light the star emits.
Model answer [4 marks]
A star is plotted at the top right of a Hertzsprung–Russell diagram. Identify the type of star and explain how its position shows this. [4]
The star is a red giant or supergiant. Being on the right of the diagram means it has a low surface temperature, since the temperature axis runs with hot on the left, and being at the top means it is very bright. A cool surface emits relatively little light from each unit of its surface area, so for the star to be very bright overall it must have an extremely large surface area. It must therefore be an extremely large star, which is what a red giant or supergiant is.
Not this: On the Hertzsprung–Russell diagram, temperature increases from left to right like a normal graph.
This: It runs BACKWARDS: hot on the LEFT and cool on the right. This is a historical convention inherited from the original diagram and it has never been changed, so every reading must be made deliberately.
Mark-losing trap. The temperature axis runs HOT ON THE LEFT. Reading it as a normal axis reverses every conclusion.
Mark-losing trap. On the magnitude scale SMALLER numbers mean BRIGHTER stars, and the brightest are negative.
Mark-losing trap. Top right = cool but bright = HUGE. Bottom left = hot but dim = TINY.
Mark-losing trap. Absolute magnitude removes distance from the comparison; apparent brightness does not.
3 · Prove it — the five questions
The five questions climb Grade 6 → Grade 7 → Grade 8 → Grade 9 → Grade 9 challenge, and are marked inside Incandio on your own device, by rule, with an authored diagnosis of the mistake you actually made. The mark schemes stay in the app so that the practice is worth doing; the questions themselves are here.
- Grade 6 · State [1 mark] — On a Hertzsprung–Russell diagram, which side of the horizontal axis has the hottest stars?
- Grade 7 · Define [2 marks] — What is meant by the absolute magnitude of a star?
- Grade 8 · Deduce [3 marks] — A star is plotted at the bottom left of a Hertzsprung–Russell diagram. What type of star is it, and what does its position tell you about its size?
- Grade 9 · Explain [6 marks] — Select every statement that belongs in a full-mark explanation of how a star's position on a Hertzsprung–Russell diagram reveals its size, which its colour alone could not.
- 9+ · Analyse [6 marks] — A student sketches a Hertzsprung–Russell diagram, places the Sun on the main sequence, and then draws an arrow showing the Sun moving down and to the left along the main sequence as it ages, arguing that 'it will shrink and get hotter as it uses up its fuel'. Select every statement that belongs in a full-mark analysis.
The people behind this science
Two ways into the same idea — the one who found a way to measure the distances this all depends on, and the one who showed that plotting two quantities can reveal a hidden law. Inside Incandio each of them answers knowing exactly which lesson you have just finished.
Edwin Hubble — the one who found a way to measure the distances this all depends on
Absolute magnitude requires knowing how far away a star is, and that is the hardest measurement in astronomy. Hubble's 1923 breakthrough used Cepheid variable stars, which announce their true brightness through the period of their pulsation — a relationship discovered by Henrietta Swan Leavitt. Compare that true brightness with how faint the star looks and the distance follows. He used it to show that the Andromeda nebula lies far outside our own galaxy, which multiplied the size of the known universe at a stroke. He is the right person to ask how a distance can be measured without going anywhere.
- “How can you measure a distance you can never travel?”
- “What is a Cepheid variable and why is it useful?”
- “What did Henrietta Leavitt discover?”
- “How did one star prove Andromeda was another galaxy?”
- “How large did people think the universe was before that?”
Johannes Kepler — the one who showed that plotting two quantities can reveal a hidden law
The whole point of this diagram is that plotting two measured quantities against each other exposes structure invisible in either alone, and Kepler is the first person to have done that decisively. His third law came from comparing each planet's distance from the Sun with its orbital period and searching for a relationship between the two columns — years of arithmetic on a table of numbers, looking for a pattern that nobody had reason to expect. He is the right second figure here because a learner meeting the HR diagram should see it as an instance of a method rather than a fact about stars.
- “What made you compare distance against period at all?”
- “How do you know when a pattern in a table is real?”
- “What would you have made of a plot of every star at once?”
- “Why do two quantities together reveal more than each alone?”
- “How many wrong relationships did you try first?”
Think you understand it?
Reading is the start. On Incandio a topic counts as mastered only once you have taught it and defended it — the two things a revision guide cannot ask of you.
Incandio this topic → Prove it. Teach it. Defend it. What does “Incandio it” mean?
- Prove it — five questions on the Hertzsprung–Russell Diagram, marked on the spot, that tell you what was missing rather than just what was wrong.
- Teach it — Explain the Hertzsprung–Russell Diagram in your own words to Ember, an AI pupil who does not have it yet and asks the awkward question. Understanding is credited; wording is not required.
- Defend it — Argue the Hertzsprung–Russell Diagram against Ejnar Hertzsprung — three rounds, marked against descriptors you can read before you begin.
- Then the exam — read all 10 authored exam-style questions on this unit, each with its command word and its tariff, then have them marked on Incandio with the mistake you actually made named.
Completely free. No subscriptions, no paywalls, no account needed to start.
Carry on through the course
- Previous lesson: The Life Cycle of Stars
- Next lesson: The Big Bang and its Evidence
- The Universe and Gravity — From a moon to the whole universe in five steps, and why your weight would change on the way.
- Orbits — Why anything in orbit is falling, why comets speed up as they arrive, and how to find an orbital speed.
- Star Colour and Temperature — Why blue stars are the hot ones, and how a colour tells you a temperature across the whole galaxy.
- The Life Cycle of Stars — Two endings from one beginning — and the mass a star is born with decides which it gets.
- The Big Bang and its Evidence — Two observations that between them decided how the universe began.
- All of Physics · Physics key terms · required practicals · equations · Incandio Science · The 4PH1 specification