Pearson Edexcel International GCSE in Physics · 4PH1 · Free · no account needed
Acceleration and the Velocity–Time Graph
What acceleration actually measures, why its unit looks strange, and how one graph gives you both acceleration and distance.
Topic 1 · Forces and motion — one of 10 lessons in this topic, and one of 65 in Physics.
This lesson ends with Nicole Oresme. Learn Acceleration and the Velocity–Time Graph, teach it, then defend it against Nicole Oresme.
The definition this lesson teaches, word for word — every Physics definition.
- Acceleration
- The rate of change of velocity. Measured in metres per second squared (m/s²).
Its equation is on the Physics equations page with the other 37.
What this lesson covers in the specification
Incandio is aligned to this specification. It is not published by, endorsed by or affiliated with Pearson, and it reproduces none of Pearson's wording — the statement numbers are given so you can check every lesson against your own copy.
- 1.6 — Use the relationship between acceleration, change in velocity and time taken
- 1.7 — Plot and explain velocity–time graphs
- 1.8 — Determine acceleration from the gradient of a velocity–time graph
- 1.9 — Determine distance travelled from the area under a velocity–time graph
- 1.10 — Use v² = u² + 2as
Specification section 1(b) Movement and position — also taught in Speed, and What a Distance–Time Graph Is Telling You.
1 · Understand it
No exam language yet. The only question this section answers is: do I actually understand what is happening?
Acceleration is a rate, exactly like speed — but a rate of change of something that was already a rate. Speed tells you how fast your position changes. Acceleration tells you how fast your speed changes. That is why its unit is metres per second, per second: m/s².
Think of it like a pay rise
Your wage is £12 per hour — that is a rate. Now suppose it goes up by £2 per hour, every year. That is a rate of change of a rate: £2 per hour per year. Nobody finds that confusing, and m/s² is the same construction. An acceleration of 3 m/s² means: every second, your speed goes up by 3 m/s.
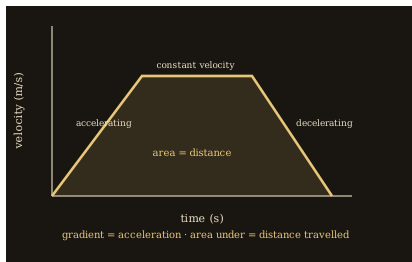
Why the area under the graph is a distance
- Take a section where the velocity is constant at 10 m/s for 6 s.
- The distance travelled is 10 × 6 = 60 m.
- On the graph, that section is a rectangle 10 tall and 6 wide — and its area is 10 × 6 = 60.
- The same argument works for a triangle, and for any shape, because velocity × time is exactly what an area on these axes means.
- So: gradient gives acceleration, area gives distance. One graph, two answers.
Worked example — using both properties
A car accelerates uniformly from rest to 20 m/s in 8 s. Find the acceleration and the distance travelled.
- Acceleration = change in velocity ÷ time = (20 − 0) ÷ 8 = 2.5 m/s².
- The graph is a triangle of base 8 s and height 20 m/s.
- Distance = area = ½ × 8 × 20 = 80 m.
Answer: 2.5 m/s² and 80 m
The fourth equation, v² = u² + 2as, exists for the case where you do not know the time. If a question gives you an initial speed, a final speed and a distance — but never mentions seconds — that is the equation being asked for. Recognising WHICH equation to use is most of the skill.
2 · Grade 9 Notes
A different job from the section above. You have already understood it; this is the precise set of things to LEARN — definitions to reproduce word for word, processes in order, equations with units, and the answers that score full marks.
Learn this definition · Acceleration
The rate of change of velocity. Measured in metres per second squared (m/s²).
The five symbols — know these before any calculation
- u
- initial velocity, in m/s
- v
- final velocity, in m/s
- a
- acceleration, in m/s². Negative when slowing down.
- s
- distance moved, in m
- t
- time taken, in s
a = (v − u) ÷ t
Rearranged: v = u + at · u = v − at · t = (v − u) ÷ a. Valid only for UNIFORM acceleration — a straight line on the velocity–time graph.
Units: a in m/s², u and v in m/s, t in s. Use when a time is given or asked for.
v² = u² + 2as
Rearranged: a = (v² − u²) ÷ 2s · s = (v² − u²) ÷ 2a. Also uniform acceleration only. For a deceleration, substitute a as a NEGATIVE number.
Units: u and v in m/s, a in m/s², s in m. Use when NO time is given or asked for. The final step is a square root.
Choosing the right relationship
- List u, v, a, s, t — write down which you have and which you want.
- Time given or asked for → a = (v − u) ÷ t.
- No time anywhere → v² = u² + 2as.
- Graph given → gradient for acceleration, area for distance.
- Convert to m, s and m/s before substituting.
The two motion graphs
| Distance–time | Velocity–time | |
|---|---|---|
| Gradient | speed | acceleration |
| Area under line | no meaning | distance travelled |
| Horizontal line | stationary | constant velocity, zero acceleration |
| Straight slope | constant speed | constant acceleration |
| Curve | changing speed | changing acceleration |
| Line sloping down | returning to start | decelerating |
| Below the axis | not possible | moving in the opposite direction |
Finding distance from a velocity–time graph
- Split the area into rectangles and triangles.
- Rectangle = base × height. Triangle = ½ × base × height.
- Add the parts. Show the split — each part earns a mark.
- For a curve, count squares and state what one square is worth.
- A section BELOW the time axis is motion in the opposite direction: its area still counts towards total distance travelled, but it subtracts from the displacement.
Negative acceleration vs negative velocity — the sign trap
A. A NEGATIVE ACCELERATION means the velocity is decreasing. The line on the graph slopes downwards. For something moving forwards that means slowing down — but what is negative is the change in velocity, not the direction of travel.
B. A NEGATIVE VELOCITY means the object is moving the other way. The line is BELOW the time axis. An object can have a negative velocity and a positive acceleration at the same time: it is moving backwards and slowing down.
Model answer [3 marks]
A car accelerates uniformly from rest to 30 m/s in 20 s. Calculate the distance travelled. [3]
The graph is a triangle of base 20 s and height 30 m/s. Distance = area under the graph = ½ × base × height = ½ × 20 × 30 = 300 m.
Model answer [3 marks]
Describe the motion shown by a velocity–time graph that rises, levels off, then falls to zero. [3]
The object accelerates uniformly from rest, because the first section is a straight line with a positive gradient. It then travels at a constant velocity with zero acceleration, because the line is horizontal. It then decelerates uniformly until it stops, because the final section is a straight line with a negative gradient reaching the time axis.
Free fall
- g ≈ 10 m/s² near the Earth's surface (use the value given in the question)
- All objects accelerate at g when air resistance is ignored, whatever their mass
- With air resistance: acceleration falls to zero at terminal velocity
Mark-losing trap. Use the CHANGE in velocity, (v − u), not the final velocity.
Mark-losing trap. v² = u² + 2as gives you v², not v. Take the square root.
Mark-losing trap. A negative acceleration means the velocity is FALLING. That is only 'slowing down' if the object is moving forwards to begin with.
Mark-losing trap. A downward-sloping line is deceleration. A line BELOW the axis is the opposite direction. They are different things and a graph can show both.
Mark-losing trap. Both equations assume UNIFORM acceleration. If the graph curves, neither one applies to the whole journey.
Mark-losing trap. A curved line has no single gradient: draw a tangent for the acceleration at an instant.
3 · Prove it — the five questions
The five questions climb Grade 6 → Grade 7 → Grade 8 → Grade 9 → Grade 9 challenge, and are marked inside Incandio on your own device, by rule, with an authored diagnosis of the mistake you actually made. The mark schemes stay in the app so that the practice is worth doing; the questions themselves are here.
- Grade 6 · Calculate [2 marks] — A car speeds up from 5 m/s to 25 m/s in 4 s. Calculate its acceleration.
- Grade 7 · Calculate [3 marks] — A velocity–time graph is a straight line passing through 5 m/s at t = 2 s and 23 m/s at t = 8 s. Calculate the acceleration from the gradient.
- Grade 8 · Calculate [4 marks] — A velocity–time graph has three sections: first a straight line rising from the origin, then a horizontal line, then a straight line falling back to the time axis. Select every statement that belongs in a full-mark description of the motion.
- Grade 9 · Calculate [3 marks] — A cyclist travelling at 4 m/s accelerates at 1.5 m/s² over a distance of 30 m. Calculate her final speed.
- 9+ · Analyse [5 marks] — A velocity–time graph shows a lift: it rises from 0 to 3 m/s in 4 s, stays at 3 m/s for 10 s, then returns to rest in 2 s. It then descends, and the graph shows a constant −2 m/s for 5 s, below the time axis. Calculate the total distance travelled by the lift.
The people behind this science
Two ways into the same idea — the one who built the mathematics of change, and the one who discovered uniform acceleration. Inside Incandio each of them answers knowing exactly which lesson you have just finished.
Isaac Newton — the one who built the mathematics of change
This lesson asks you to take a gradient at a point and an area under a line. Newton invented the mathematics that does exactly those two things, because changing motion could not be described any other way — the calculus and the physics were the same problem.
- “Why did describing changing motion force you to invent new mathematics?”
- “What does the gradient of a curve actually tell you about a moving object?”
- “Why does the area under a velocity graph turn out to be a distance?”
- “What is the difference between an average speed and a speed at one instant?”
- “What made you certain the same rules governed a falling apple and the Moon?”
Galileo Galilei — the one who discovered uniform acceleration
Before Galileo, everyone believed heavier objects fall faster and that falling was not something you could put a number on. He showed on inclined planes that the distance covered grows with the square of the time — which is v² = u² + 2as in disguise, and the reason your graph is a straight line.
- “How did you show that a falling object gains speed at a steady rate?”
- “Why does a ball roll four times as far in twice the time?”
- “Did you really drop objects from a tower, and would it have proved anything?”
- “Why does a heavy ball not fall faster than a light one?”
- “How did rolling balls down a slope tell you anything about falling?”
Think you understand it?
Reading is the start. On Incandio a topic counts as mastered only once you have taught it and defended it — the two things a revision guide cannot ask of you.
Incandio this topic → Prove it. Teach it. Defend it. What does “Incandio it” mean?
- Prove it — five questions on Acceleration and the Velocity–Time Graph, marked on the spot, that tell you what was missing rather than just what was wrong.
- Teach it — Explain Acceleration and the Velocity–Time Graph in your own words to Ember, an AI pupil who does not have it yet and asks the awkward question. Understanding is credited; wording is not required.
- Defend it — Argue Acceleration and the Velocity–Time Graph against Nicole Oresme — three rounds, marked against descriptors you can read before you begin.
- Then the exam — read all 12 authored exam-style questions on this unit, each with its command word and its tariff, then have them marked on Incandio with the mistake you actually made named.
Completely free. No subscriptions, no paywalls, no account needed to start.
Carry on through the course
- Previous lesson: Speed, and What a Distance–Time Graph Is Telling You
- Next lesson: Forces, Vectors and Scalars
- Speed, and What a Distance–Time Graph Is Telling You — Speed as a rate, the units physics insists on, and how to read a journey straight off a graph.
- Forces, Vectors and Scalars — What a force actually does, why some quantities need a direction to mean anything, and why that makes a force one of them.
- Resultant Force, Friction and F = ma — Why a moving object stops, what really happens when you add forces up, and the one equation that connects force to motion.
- Weight and Terminal Velocity — What weight actually is, why it is not the same as mass, and what happens to a falling object once the air starts pushing back.
- Stopping Distance — Why a car does not stop when you decide to stop it — and which of the two distances each factor actually lengthens.
- All of Physics · Physics key terms · required practicals · equations · Incandio Science · The 4PH1 specification