Pearson Edexcel International GCSE in Physics · 4PH1 · Free · no account needed
Speed, and What a Distance–Time Graph Is Telling You
Speed as a rate, the units physics insists on, and how to read a journey straight off a graph.
Topic 1 · Forces and motion — one of 10 lessons in this topic, and one of 65 in Physics.
This lesson ends with Galileo Galilei. Learn Speed, and What a Distance–Time Graph Is Telling You, teach it, then defend it against Galileo Galilei.
The 2 definitions this lesson teaches, word for word — every Physics definition.
One of the 17 Physics required practicals · Its equation is on the Physics equations page with the other 37.
What this lesson covers in the specification
Incandio is aligned to this specification. It is not published by, endorsed by or affiliated with Pearson, and it reproduces none of Pearson's wording — the statement numbers are given so you can check every lesson against your own copy.
- 1.1 — Use the units kg, m, m/s, m/s², N, s and N/kg
- 1.3 — Plot and explain distance–time graphs
- 1.4 — Use the relationship between average speed, distance moved and time taken
- 1.5 — Practical: investigate the motion of everyday objects such as toy cars or tennis balls (required practical)
Specification section 1(a) Units — also taught in Momentum.
1 · Understand it
No exam language yet. The only question this section answers is: do I actually understand what is happening?
Speed is not a thing an object has. It is a comparison: how much distance, per unit of time. That is what the slash in 'm/s' means — metres, for every one second. Read the unit aloud as 'metres per second' and the equation is already written for you.
Think of it like a wage
If someone earns £12 an hour, you do not ask 'how much money is that?' — you ask 'for how long?'. £12 per hour is a RATE, and to get a total you multiply by time. Speed works identically: 12 m/s is a rate, and distance = speed × time is the same multiplication. Every rate in physics behaves this way, which is why so many equations look alike.
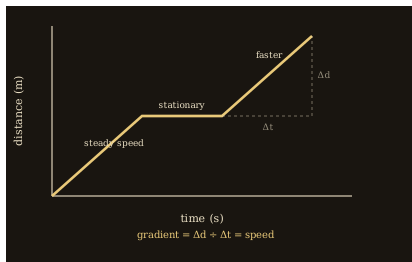
Reading a distance–time graph
- A straight sloping line means constant speed. The steeper it is, the faster the object is going.
- A horizontal line means the distance is not changing — the object is stationary.
- A curve getting steeper means the object is speeding up; a curve flattening means it is slowing down.
- The gradient of the line IS the speed. Take any two points, divide the change in distance by the change in time.
Worked example — reading a gradient
On a distance–time graph, a runner is at 20 m after 4 s and at 80 m after 12 s. Find their speed over that section.
- Change in distance = 80 − 20 = 60 m.
- Change in time = 12 − 4 = 8 s.
- Speed = gradient = 60 ÷ 8 = 7.5 m/s.
Answer: 7.5 m/s
One habit worth building now: always write the unit. In physics, a number without a unit is not an answer — 7.5 could be metres per second, kilometres per hour, or miles per fortnight. Marks are lost for this every year, and it costs nothing to avoid.
2 · Grade 9 Notes
A different job from the section above. You have already understood it; this is the precise set of things to LEARN — definitions to reproduce word for word, processes in order, equations with units, and the answers that score full marks.
Learn this definition · Speed
The distance moved per unit time. Speed is a scalar: it has magnitude only.
Learn this definition · Velocity
Speed in a stated direction. Velocity is a vector: it has magnitude and direction.
average speed = distance moved ÷ time taken
Rearranged: distance = speed × time · time = distance ÷ speed
Units: m/s. Distance in m, time in s.
The units this topic requires
- kilogram (kg)
- mass
- metre (m)
- distance
- second (s)
- time
- metre/second (m/s)
- speed and velocity
- metre/second² (m/s²)
- acceleration
- newton (N)
- force
- newton/kilogram (N/kg)
- gravitational field strength
Converting units before you substitute
- km → m: × 1000. hours → s: × 3600.
- km/h → m/s: ÷ 3.6. So 72 km/h ÷ 3.6 = 20 m/s.
- m/s → km/h: × 3.6. So 15 m/s × 3.6 = 54 km/h.
- Sense check: the number in m/s is always the SMALLER of the two.
- Write the conversion on its own line — it carries its own mark.
Reading a distance–time graph
- Gradient = speed
- Horizontal line = stationary
- Straight slope = constant speed; steeper = faster
- Curve steepening = speeding up; curve flattening = slowing down
- Slope downwards = moving back towards the starting point
- Gradient = (d₂ − d₁) ÷ (t₂ − t₁), taken from two points on the line
Two things both called 'distance' — and only one of them can go down
A. DISTANCE FROM THE START is what these graphs plot, which is why the line can slope back down towards zero when the object returns. At the moment it reaches the start again, the graph reads zero.
B. TOTAL DISTANCE TRAVELLED never decreases — it keeps counting on the way back. It is what average speed uses, and for an out-and-back journey it is double the distance out while the graph has returned to zero.
Speed vs velocity
| Speed | Velocity | |
|---|---|---|
| Type | scalar | vector |
| Needs a direction | no | yes |
| Uses | distance travelled | displacement |
| Out-and-back journey | positive value | zero |
Model answer [3 marks]
Describe the motion shown by a distance–time graph that slopes up steeply, is then horizontal, then slopes up less steeply. [3]
The object first travels at a constant, high speed, because the line is straight and steep. It is then stationary, because the horizontal section means the distance is not changing. It then travels at a constant but lower speed, because the second slope is straight but less steep than the first.
Model answer [3 marks]
A cyclist covers 1.8 km in 4.0 minutes. Calculate the average speed in m/s. [3]
Convert first: 1.8 km = 1800 m and 4.0 minutes = 240 s. Average speed = distance ÷ time = 1800 ÷ 240 = 7.5 m/s.
Required practical (1.5): investigating the motion of everyday objects
- Set light gates a measured distance apart, or mark the track at equal intervals.
- Fix a card of known length to the trolley so the gate times a known distance.
- The speed at that gate = length of the card ÷ the time the beam was interrupted.
- Release the trolley from the same marked point each run — release, never push.
- Record the time at each gate with a data logger.
- Repeat three times, take a mean, and identify any anomaly.
- Plot distance against time; draw a line of best fit; take the gradient over a large section.
Variables. Independent: distance along the track. Dependent: time taken. Control: release point, ramp angle, surface, mass of trolley — each changes the accelerating force or friction, so changing one would make the comparison invalid.
Sources of error and improvement. Systematic: reaction time (~0.2 s) applies at start and stop and is the same direction each run, so averaging cannot remove it — use light gates. Random: variation in release, and parallax when reading the rule — repeat, and read at eye level. Improve precision by timing over a longer distance, so the same uncertainty is a smaller percentage.
The four evaluation words examiners separate
- Accurate
- close to the true value
- Precise
- repeats close to each other — can be precise and consistently wrong
- Repeatable
- same person, same method, same values again
- Valid
- actually tests what it claims, because control variables were held constant
Mark-losing trap. A horizontal line means stationary, not constant speed.
Mark-losing trap. Gradient uses the CHANGE in each quantity, not a single reading divided by its time.
Mark-losing trap. For the speed at an instant on a curve, draw a tangent and take its gradient.
Mark-losing trap. Average speed uses total distance ÷ total time, including time spent stationary.
Mark-losing trap. A number with no unit is not an answer.
3 · Prove it — the five questions
The five questions climb Grade 6 → Grade 7 → Grade 8 → Grade 9 → Grade 9 challenge, and are marked inside Incandio on your own device, by rule, with an authored diagnosis of the mistake you actually made. The mark schemes stay in the app so that the practice is worth doing; the questions themselves are here.
- Grade 6 · Calculate [2 marks] — A cyclist travels 150 m in 12 s. Calculate their average speed.
- Grade 7 · Describe [1 mark] — What does a horizontal section on a distance–time graph tell you about the object's motion?
- Grade 8 · Calculate [3 marks] — On a distance–time graph, a car is at 40 m at t = 5 s and at 160 m at t = 15 s. Calculate the speed over this section.
- Grade 9 · Explain [4 marks] — A student times a trolley over 1.0 m using a hand-held stopwatch and gets 0.9 s, 1.2 s and 0.7 s. Explain why their measurement of speed is unreliable and give one specific improvement.
- 9+ · Analyse [4 marks] — A journey has three sections: 300 m out in 20 s, then stationary for 10 s, then 300 m back to the start in 30 s. Calculate the average speed for the whole journey, in km/h.
The people behind this science
Two ways into the same idea — the one who had to measure it first, and the one who turned it into mathematics. Inside Incandio each of them answers knowing exactly which lesson you have just finished.
Galileo Galilei — the one who had to measure it first
Your practical is really Galileo's problem: how do you time something moving too fast to time? He rolled balls down ramps to slow motion down, and used a water clock and his own pulse because no accurate timer existed. Every timing-error question on this page descends from that.
- “How did you measure how long a rolling ball took, with no accurate clock?”
- “Why did you roll balls down a ramp instead of simply dropping them?”
- “Your timing must have been rough — how did you know your results meant anything?”
- “How did you decide which quantities to hold constant between runs?”
- “What would you make of a light gate that measures to a thousandth of a second?”
Isaac Newton — the one who turned it into mathematics
Galileo measured motion; Newton explained it. The idea that a straight sloping line on your graph — equal distances in equal times, going on for ever with nothing pushing — is what an object does when NO force acts on it is Newton's first law, and it is the single most counter-intuitive claim in this topic.
- “Why does an object keep moving when nothing is pushing it?”
- “Everyday experience says moving things stop on their own. Why is that wrong?”
- “What is the difference between speed and velocity, and why does the difference matter?”
- “Why did describing motion properly require you to invent new mathematics?”
- “How would you convince a student that a constant speed needs no force at all?”
Think you understand it?
Reading is the start. On Incandio a topic counts as mastered only once you have taught it and defended it — the two things a revision guide cannot ask of you.
Incandio this topic → Prove it. Teach it. Defend it. What does “Incandio it” mean?
- Prove it — five questions on Speed, and What a Distance–Time Graph Is Telling You, marked on the spot, that tell you what was missing rather than just what was wrong.
- Teach it — Explain Speed, and What a Distance–Time Graph Is Telling You in your own words to Ember, an AI pupil who does not have it yet and asks the awkward question. Understanding is credited; wording is not required.
- Defend it — Argue Speed, and What a Distance–Time Graph Is Telling You against Galileo Galilei — three rounds, marked against descriptors you can read before you begin.
- Then the exam — read all 12 authored exam-style questions on this unit, each with its command word and its tariff, then have them marked on Incandio with the mistake you actually made named.
Completely free. No subscriptions, no paywalls, no account needed to start.
Carry on through the course
- Next lesson: Acceleration and the Velocity–Time Graph
- Acceleration and the Velocity–Time Graph — What acceleration actually measures, why its unit looks strange, and how one graph gives you both acceleration and distance.
- Forces, Vectors and Scalars — What a force actually does, why some quantities need a direction to mean anything, and why that makes a force one of them.
- Resultant Force, Friction and F = ma — Why a moving object stops, what really happens when you add forces up, and the one equation that connects force to motion.
- Weight and Terminal Velocity — What weight actually is, why it is not the same as mass, and what happens to a falling object once the air starts pushing back.
- Stopping Distance — Why a car does not stop when you decide to stop it — and which of the two distances each factor actually lengthens.
- All of Physics · Physics key terms · required practicals · equations · Incandio Science · The 4PH1 specification